Linear regression is one of the easiest algorithms in machine learning, is used for finding a linear relationship between two variables (target and predictors) with the linear equation. there are two types of linear regression:
- Simple Linear Regression
- Multiple Linear Regression
Today I’m going to start with ” Simple Linear Regression “
A simple Linear Regression is basically this formula, where Y = A + B*X and you might recognize this formula from back in high school. let’s go through these variables and coefficients one by one.

Objective
The objective of this tutorial is to predict the salary of an employee according to the number of years of experience he has.
Dataset
When you look at the dataset (can be found here). you see that it has 3 columns “Index”, “YearsExperience” and “Salary” for 30 employees in an X company. So, we will train a Simple Linear Regression model to learn the correlation between “YearsExperience” of each employee and their respective “Salary”.
Step 1: Import Libraries
we will use 4 libraries such as :
– NumPy: import numpy as np
– Pandas: import pandas as pd to work with a dataset
– Matplotlib: import matplotlib.pyplot as plt to visualize our plots for viewing
– Sklearn: from sklearn.linear_model import LinearRegression to implement machine learning functions, in this example, we use Linear Regression
Step 2: Load the Dataset
We will be using the pandas dataframe. Here X is the independent variable which is the second column which contains Years of Experience array and y is the dependent variable which is the last column which contains Salary array.
So for X, we specify : X = dataset.iloc[:, 1:-1].values
and for y, we specify : y = dataset.iloc[:, -1].values
Step 3: Split Data
Next, we have to split our dataset into a training dataset for training the model and testing to check the performance of the model, to do this we need to use the train_test_split method from library model_selection.
Code Explanation :
test_size = 1/3 : we will split our dataset into 2 parts (training set, test set) and the ratio of test set compared to a dataset is 1/3, which means test set will contain 10 observations, and the training set will contain 20 observations. We should not let the test set too big; if it’s too big, we will lack data to train. Normally, we should pick around 5% to 30%.
random_state = 0 : this is the seed for the random number generator, which is required only if you want to compare your results with mine. If we leave it blank or 0, the RandomState instance used by np.random will be used instead.
Step 4: build the Regression Model
It’s a very simple step. We will use the LinearRegression class from the sklearn.linear_model library. First, we create an object of the LinearRegression class and call the fit method passing the X_train and y_train.
Code Explanation :
- regressor = LinearRegression() : our training model which will implement the Linear Regression.
- regressor.fit(X_train, y_train) : This is the training process. we pass the X_train which contains a value of Year Experience and y_train which contains values of particular Salary to form up the model.
Step 5: Predict the test set
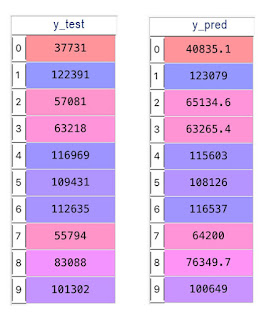
After we have training our regressor, we will now use it to predict the results of the test set and compare the predicted values with the real values.
Let’s compare to see if our model did well.

If we take the first employee, the real salary is 37731 and our model predicts 40835.1, which is not too bad. Some predictions are off, but some are fairly close.
Step 6: visualize the training model and testing model
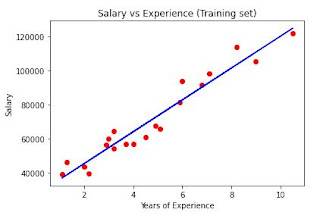
Training Set :to visualize the results, we’ll plot the actual data points of the training set X_train and y_train, next we’ll plot the regression line which is the predicted values for the X_train.

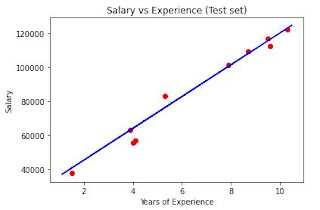
Test Set :Let’s visualize the test results. First, we’ll plot the actual data points of the training set X_test and y_test, next we’ll plot the regression line which is the same as above.

Step 7: Predict an Employee Salary
Alright! We already have the model, now we can use it to predict an Employee Salary based on his years of experience. This is how we do it, for example a person with 15 years experience
YEAH! 😎 The value of salary_pred with X = 15 (15 Years Experience) is 167005.32889087 $
Simple Linear Regression, we need to follow 5 steps as per below:
- Importing the dataset.
- Splitting dataset into a training set and testing set (Normally, the testing set should be 5% to 30% of the dataset).
- Initializing the regression model and fitting it using a training set.
- Visualize the training set and testing set (you can skip this step if you want).
- Make new predictions
- If you want to share your models with me on Kaggle here is the link to our dataset: Salary Data – Kaggle.
- Here is the Full Source Code.


